RegionBoundingBox
- class regions.RegionBoundingBox(ixmin, ixmax, iymin, iymax)[source]
Bases:
objectA rectangular bounding box in integer (not float) pixel indices.
- Parameters:
- ixmin, ixmax, iymin, iymaxint
The bounding box pixel indices. Note that the upper values (
iymaxandixmax) are exclusive as for normal slices in Python. The lower values (ixminandiymin) must not be greater than the respective upper values (ixmaxandiymax).
Examples
>>> from regions import RegionBoundingBox
>>> # constructing a RegionBoundingBox like this is cryptic:
>>> bbox = RegionBoundingBox(1, 10, 2, 20)
>>> # it's better to use keyword arguments for readability:
>>> bbox = RegionBoundingBox(ixmin=1, ixmax=10, iymin=2, iymax=20)
>>> bbox  # nice repr, useful for interactive work
RegionBoundingBox(ixmin=1, ixmax=10, iymin=2, iymax=20)
>>> # sometimes it's useful to check if two bounding boxes are the same
>>> bbox == RegionBoundingBox(ixmin=1, ixmax=10, iymin=2, iymax=20)
True
>>> bbox == RegionBoundingBox(ixmin=7, ixmax=10, iymin=2, iymax=20)
False
>>> # "center" and "shape" can be useful when working with numpy arrays
>>> bbox.center  # numpy order: (y, x)
(10.5, 5.0)
>>> bbox.shape  # numpy order: (y, x)
(18, 9)
>>> # "extent" is useful when plotting the RegionBoundingBox with
>>> # matplotlib
>>> bbox.extent  # matplotlib order: (x, y)
(0.5, 9.5, 1.5, 19.5)
Attributes Summary
The
(y, x)center of the bounding box.The extent of the mask, defined as the
(xmin, xmax, ymin,
ymax)
bounding box from the bottom-left corner of the lower- left pixel to the upper-right corner of the upper-right pixel.The
(ny, nx)shape of the bounding box.Methods Summary
as_artist(**kwargs)Return a
matplotlib.patches.Rectanglethat represents the bounding box.from_float(xmin, xmax, ymin, ymax)Return the smallest bounding box that fully contains a given rectangle defined by float coordinate values.
get_overlap_slices(shape)Get slices for the overlapping part of the bounding box and an 2D array.
intersection(other)Return a
RegionBoundingBoxrepresenting the intersection of thisRegionBoundingBoxwith anotherRegionBoundingBox.plot([origin, ax])Plot the
RegionBoundingBoxon a matplotlibAxesinstance.Return a
RectanglePixelRegionthat represents the bounding box.union(other)Return a
RegionBoundingBoxrepresenting the union of thisRegionBoundingBoxwith anotherRegionBoundingBox.Attributes Documentation
- center
The
(y, x)center of the bounding box.
- extent
The extent of the mask, defined as the
(xmin, xmax, ymin, ymax)bounding box from the bottom-left corner of the lower- left pixel to the upper-right corner of the upper-right pixel.The upper edges here are the actual pixel positions of the edges, i.e., they are not “exclusive” indices used for python indexing. This is useful for plotting the bounding box using Matplotlib.
- shape
The
(ny, nx)shape of the bounding box.
Methods Documentation
- as_artist(**kwargs)[source]
Return a
matplotlib.patches.Rectanglethat represents the bounding box.- Parameters:
- **kwargsdict
Any keyword arguments accepted by
matplotlib.patches.Patch.
- Returns:
- result
matplotlib.patches.Rectangle A matplotlib rectangular patch.
- result
Examples
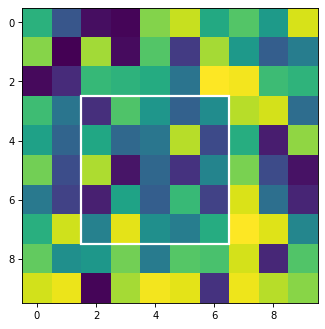
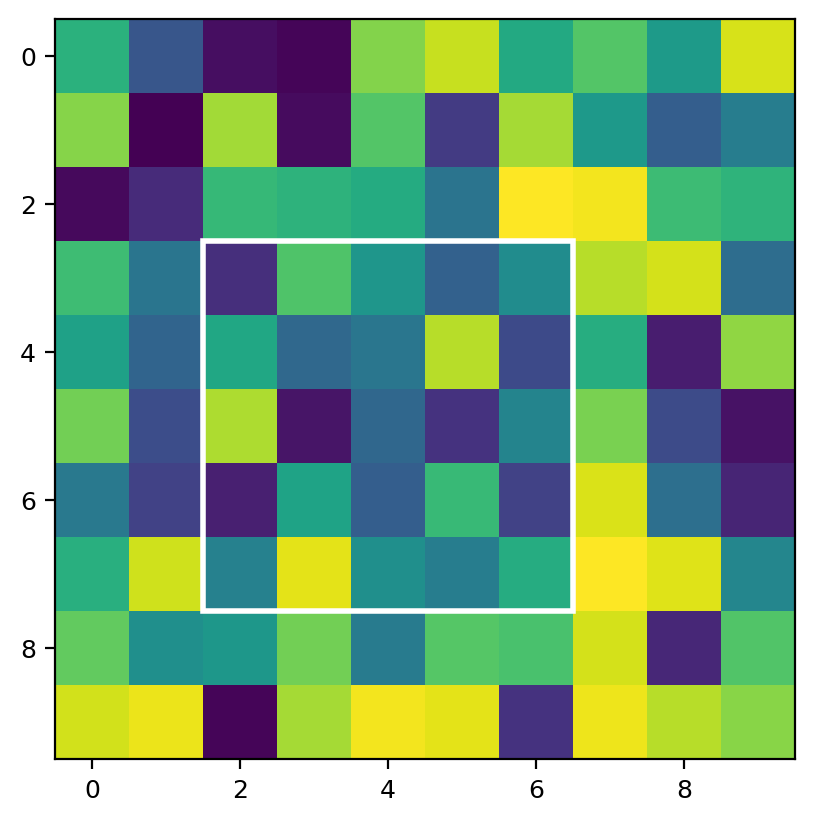
import numpy as np
import matplotlib.pyplot as plt
from regions import RegionBoundingBox
bbox = RegionBoundingBox(2, 7, 3, 8)
fig = plt.figure()
ax = fig.add_subplot(1, 1, 1)
rng = np.random.default_rng(0)
ax.imshow(rng.random((10, 10)), interpolation='nearest',
          cmap='viridis')
ax.add_patch(bbox.as_artist(facecolor='none', edgecolor='white',
             lw=2.))
(
Source code,png,hires.png,pdf,svg)
- classmethod from_float(xmin, xmax, ymin, ymax)[source]
Return the smallest bounding box that fully contains a given rectangle defined by float coordinate values.
Following the pixel index convention, an integer index corresponds to the center of a pixel and the pixel edges span from (index - 0.5) to (index + 0.5). For example, the pixel edge spans of the following pixels are:
pixel 0: from -0.5 to 0.5
pixel 1: from 0.5 to 1.5
pixel 2: from 1.5 to 2.5
In addition, because
RegionBoundingBoxupper limits are exclusive (by definition), 1 is added to the upper pixel edges. See examples below.- Parameters:
- xmin, xmax, ymin, ymaxfloat
Float coordinates defining a rectangle. The lower values (
xminandymin) must not be greater than the respective upper values (xmaxandymax).
- Returns:
- bbox
RegionBoundingBoxobject The minimal
RegionBoundingBoxobject fully containing the input rectangle coordinates.
- bbox
Examples
>>> from regions import RegionBoundingBox
>>> RegionBoundingBox.from_float(xmin=1.0, xmax=10.0,
...                              ymin=2.0, ymax=20.0)
RegionBoundingBox(ixmin=1, ixmax=11, iymin=2, iymax=21)
>>> RegionBoundingBox.from_float(xmin=1.4, xmax=10.4,
...                              ymin=1.6, ymax=10.6)
RegionBoundingBox(ixmin=1, ixmax=11, iymin=2, iymax=12)
- get_overlap_slices(shape)[source]
Get slices for the overlapping part of the bounding box and an 2D array.
- Parameters:
- shape2-tuple of int
The shape of the 2D array.
- Returns:
- slices_largetuple of slices or
None A tuple of slice objects for each axis of the large array, such that
large_array[slices_large]extracts the region of the large array that overlaps with the small array.Noneis returned if there is no overlap of the bounding box with the given image shape.- slices_smalltuple of slices or
None A tuple of slice objects for each axis of an array enclosed by the bounding box such that
small_array[slices_small]extracts the region that is inside the large array.Noneis returned if there is no overlap of the bounding box with the given image shape.
- slices_largetuple of slices or
- intersection(other)[source]
Return a
RegionBoundingBoxrepresenting the intersection of thisRegionBoundingBoxwith anotherRegionBoundingBox.- Parameters:
- other
RegionBoundingBox The
RegionBoundingBoxto intersect with this one.
- other
- Returns:
- result
RegionBoundingBox A
RegionBoundingBoxrepresenting the intersection of the inputRegionBoundingBoxwith this one.
- result
- plot(origin=(0, 0), ax=None, **kwargs)[source]
Plot the
RegionBoundingBoxon a matplotlibAxesinstance.- Parameters:
- originarray_like, optional
The
(x, y)position of the origin of the displayed image.- ax
matplotlib.axes.Axes, optional - **kwargsdict
Any keyword arguments accepted by
matplotlib.patches.Patch.
- Returns:
- patch
matplotlib.patches.Patch The matplotlib patch object for the plotted bounding box. The patch can be used, for example, when adding a plot legend.
- patch
- to_region()[source]
Return a
RectanglePixelRegionthat represents the bounding box.
- union(other)[source]
Return a
RegionBoundingBoxrepresenting the union of thisRegionBoundingBoxwith anotherRegionBoundingBox.- Parameters:
- other
RegionBoundingBox The
RegionBoundingBoxto join with this one.
- other
- Returns:
- result
RegionBoundingBox A
RegionBoundingBoxrepresenting the union of the inputRegionBoundingBoxwith this one.
- result